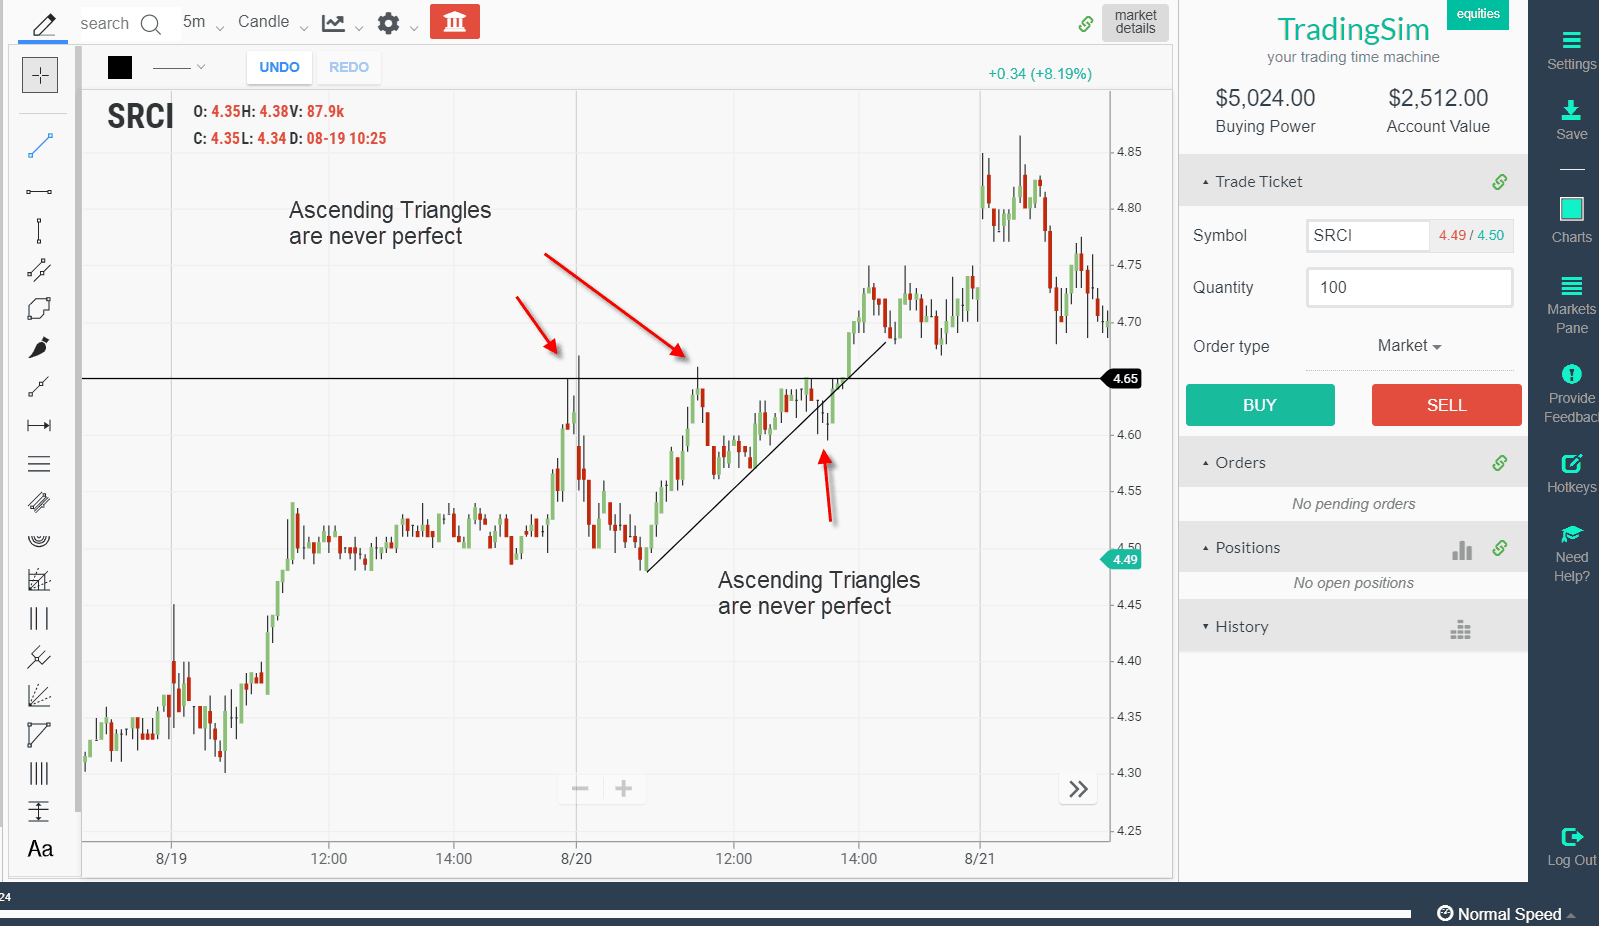
Chart Patterns (3)

How to escape a bull trap | TradingSim

7 min read

Bull Trap – How to Escape the Setup

Bull Trap – How to Escape the Setup

8 min read

How to Fade Blow-off Tops [Updated April 2026]

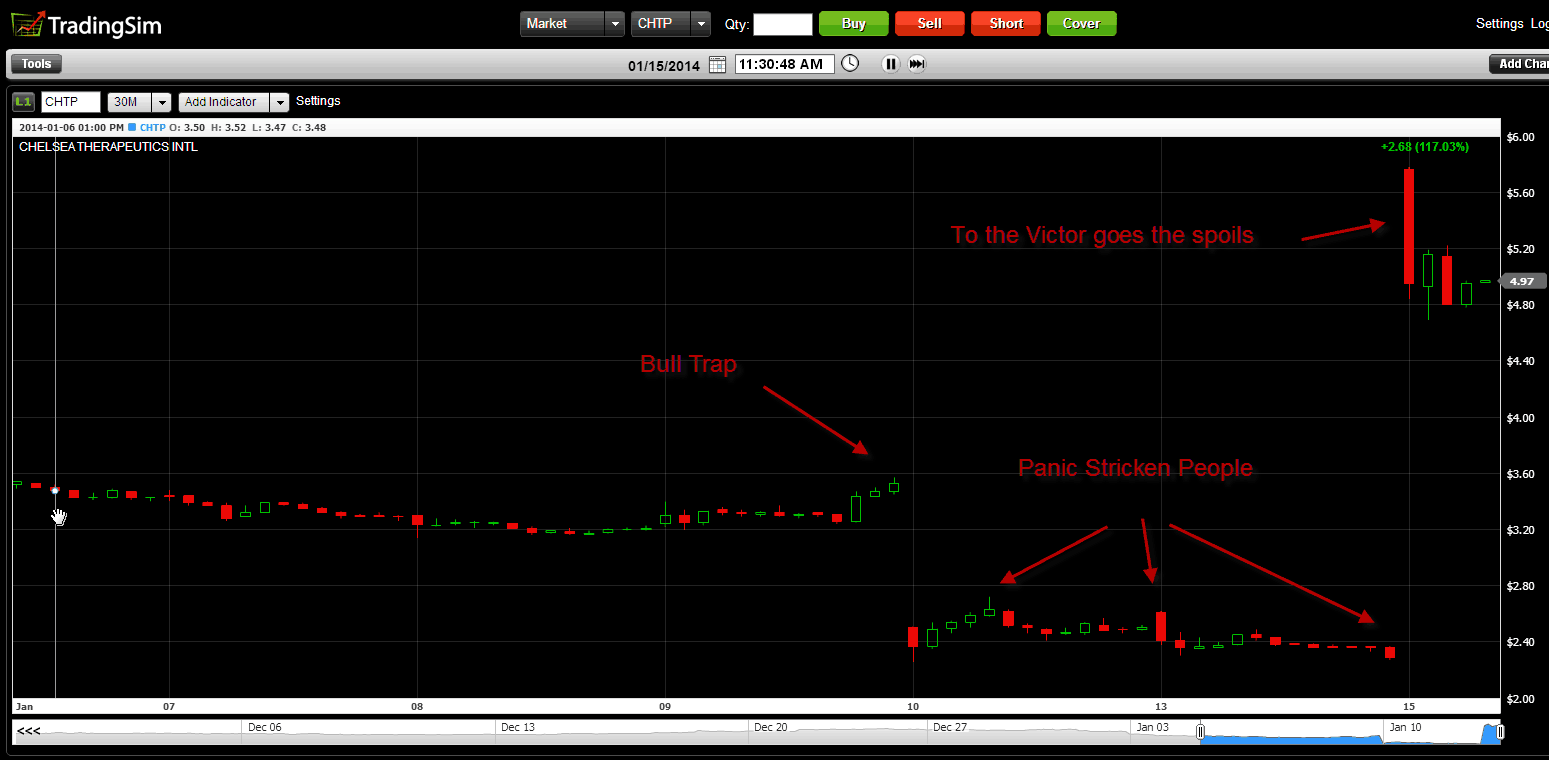
A blow-off top is a technical chart pattern that is identified by a very sharp and rapid increase in a security’s price including volume which is...

How to Fade Blow-off Tops [Updated April 2026]
The Kicker Candlestick Pattern vs. Exhaustion Gap | TradingSim

5 min read

The Kicker Candlestick Pattern vs. Exhaustion Gap

The Kicker Candlestick Pattern vs. Exhaustion Gap
5 Tips for Confirming and Trading the Bump and Run | TradingSim

6 min read

5 Tips for Confirming and Trading the Bump and Run

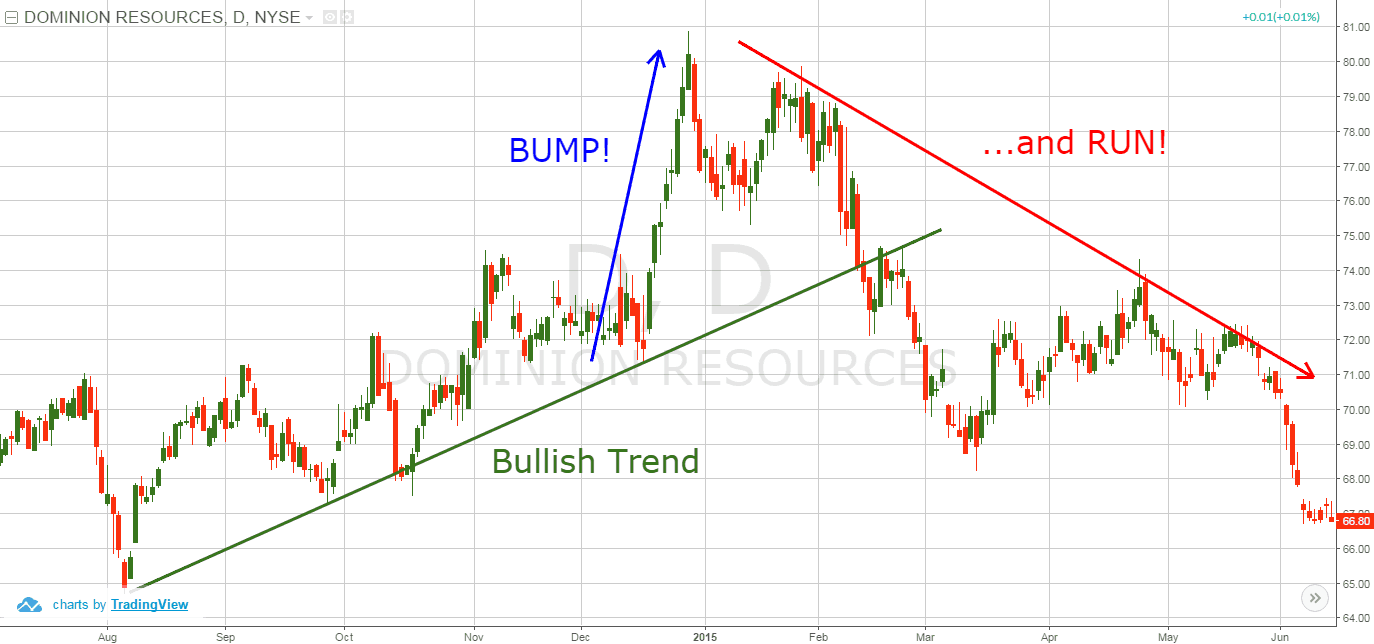
The bump and run chart pattern is a rare formation. So, to make things simple, we will walk you through 5 easy steps for identifying the pattern.

5 Tips for Confirming and Trading the Bump and Run
Trading the Rectangle Pattern Formation | TradingSim

7 min read

Rectangle Pattern: 5 Steps for Day Trading the Formation

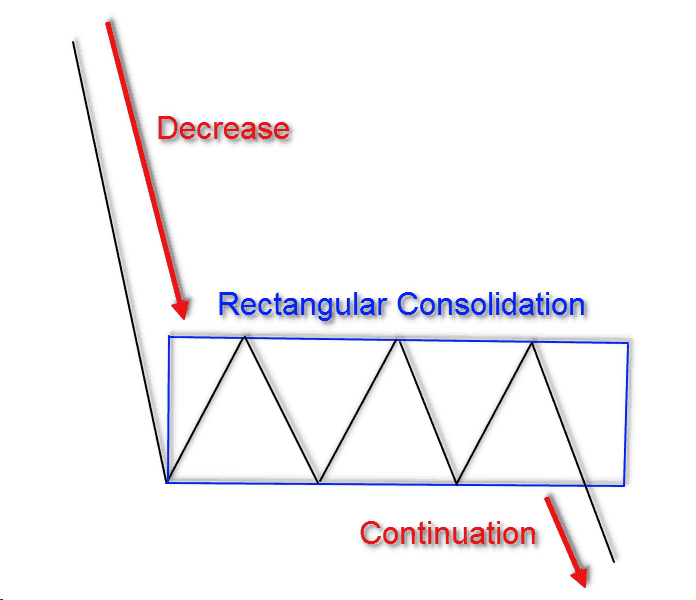
Today we will discuss one of the most popular continuation formations in trading – the rectangle pattern.

Rectangle Pattern: 5 Steps for Day Trading the Formation